A roundtrip flight between Baltimore and San Francisco emits about 480 kilograms of greenhouse gas. But what does four hundred kilograms of gas even look like – and what does the sooty mixture of carbon dioxide, nitrogen oxides, and sulphate do to our climate when emitted from 30,000 feet up in the air?
Increasing understanding of air travel-related emissions is a key goal of a new project supported by the university’s Campus as a Living Lab program. Rose Weeks, MPH, DrPH student, and Senior Research Associate at the Johns Hopkins Bloomberg School of Public Health, studies organizational behavior such as the how-to of making changes to health services. Under the Campus as a Living Lab project, she is spearheading the creation of a climate dashboard that visualizes emissions from university business travel to raise awareness and inform strategies to mitigate associated greenhouse gas emissions.
What is the goal of the climate dashboard project?
Goal 3.3 of JHU’s Climate Action and Sustainability Plan is to “Establish a scope 3 greenhouse gas (GHG) emissions reduction initiative.” Scope 3 emissions are indirect emissions from all campus activities (other than direct emissions from burning fossil fuels on campus and indirect emissions from energy and electricity purchases) that influence GHG emissions.
To achieve Goal 3.3, key actions are necessary, including: initiation of data collection and measurement of scope 3 GHG emissions categories, development of an implementation plan to report and reduce scope 3 GHG emissions, and development of criteria for local, value-aligned carbon offsets that reflect environmental justice and equity priorities.
The Climate Dashboard for Business Travel addresses these necessary actions. The project aims to communicate the climate emissions impact of business travel to faculty and administrative leaders, inform estimates of JHU air travel scope 3 emissions to allow for better decision making, and foster an enabling environment, driven by faculty priorities, for mitigation efforts that address scope 3 emissions.
What resources will be utilized to construct the climate dashboard?
The Bloomberg Center for Government Excellence is providing design thinking expertise for the dashboard, facilitated by a Johns Hopkins Bloomberg School of Public Health team with experience in human-centered design.
In addition, community engagement will be valued as a critical component of building a dashboard that is accessible and usable for intended users. Weeks hopes to foster rich campus-wide engagement and harness the ingenuity of faculty, staff, and students to solve complex implementation problems. To accomplish this, Weeks and an interdisciplinary team is hosting a series of human-centered design workshops to facilitate this engagement and garner community input.
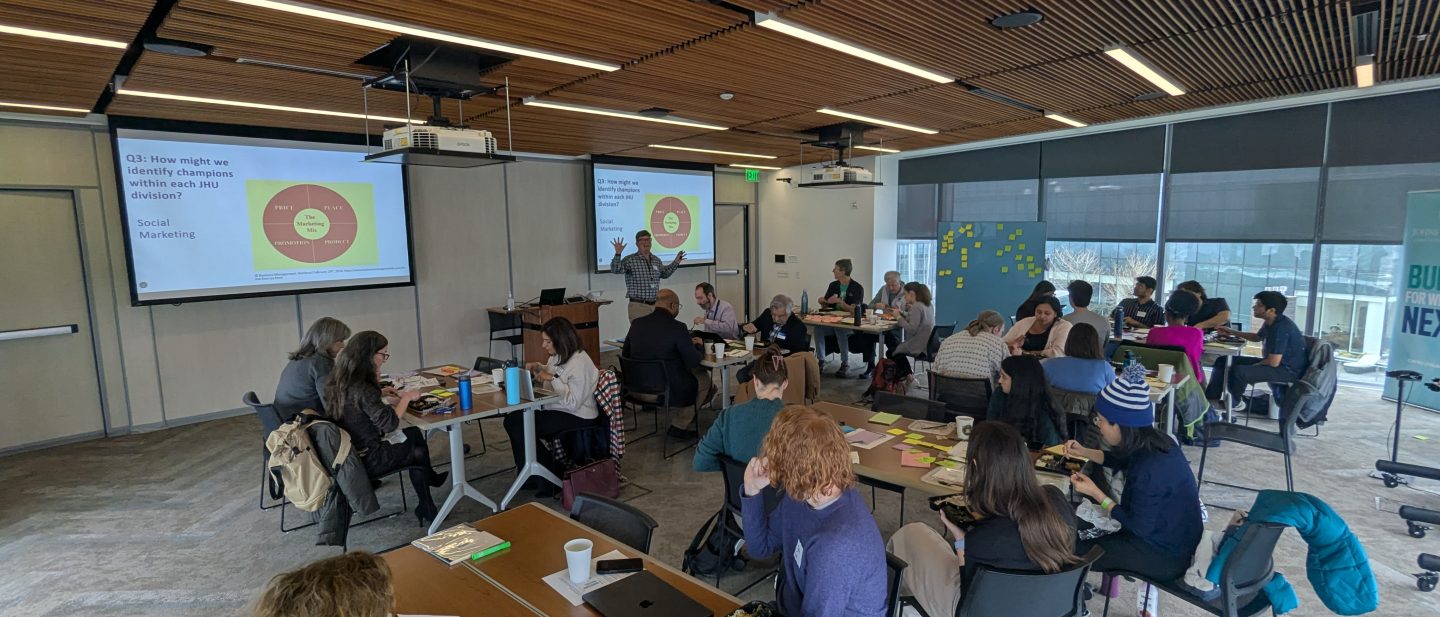
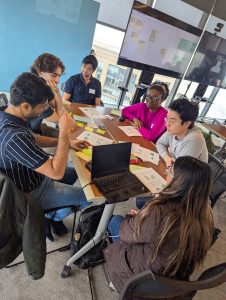
The first workshop, facilitated by Weeks and Dr. Daniel Ali at the Carey Business School on February 20, 2025, included 36 faculty, staff, and student participants. Dr. Ali, a human centered design specialist, and behavioral scientist Dr. Ryan Kennedy joined Weeks in facilitating brainstorming sessions where participants listed out what key questions the dashboard should answer about the climate impact of JHU business travel and how the dashboard should be disseminated to key decision makers across the university.
Participants discussed how the Johns Hopkins community can use the dashboard to learn about monthly trends in travel emissions as well as how the pandemic has changed travel at JHU. They also emphasized how transparent reporting on the methods used to estimate the impact of GHG will be essential.
Faculty and staff participants also suggested the dashboard should be a decision making tool to calculate travel emissions and learn how to minimize travel-related emissions associated with trips.
Weeks has employed engineering students to design the platform. Her team hopes to also engage university administrators in discussing data sourcing, hosting strategies, and long-term sustainability considerations for the dashboard.
Weeks and her team are synthesizing the learnings from the first workshop to develop a dashboard prototype. They will then host a second, virtual workshop in March to seek initial feedback on the design. A final, virtual workshop will be held to show the working dashboard in production and receive additional feedback. The dashboard will launch on April 2, 2025 at the JHU Sustainability Symposium.
If you’d like to participate in the design process, sign up here.
The climate dashboard team is grateful to support from the Carey Business School for providing the workshop space shown in photos above and for the team’s gracious hospitality.